Monthly ATM Beat HODL by 15pp: A BTC Covered Call Backtest
Covered calls are a long-standing income strategy in equity markets, popularized by products like CBOE's BXM index and BlackRock's BXMX fund. The mechanics are simple: hold the underlying, sell a call option against it, collect the premium. You give up upside above the strike in exchange for income that cushions the downside — a small, steady payment in return for capping your large, occasional gain.
The strategy is well-studied in equities. In crypto, despite a mature options market on Deribit and rising institutional interest, public analysis of covered-call performance remains thin. This post tests the strategy on BTC with two years of option data.
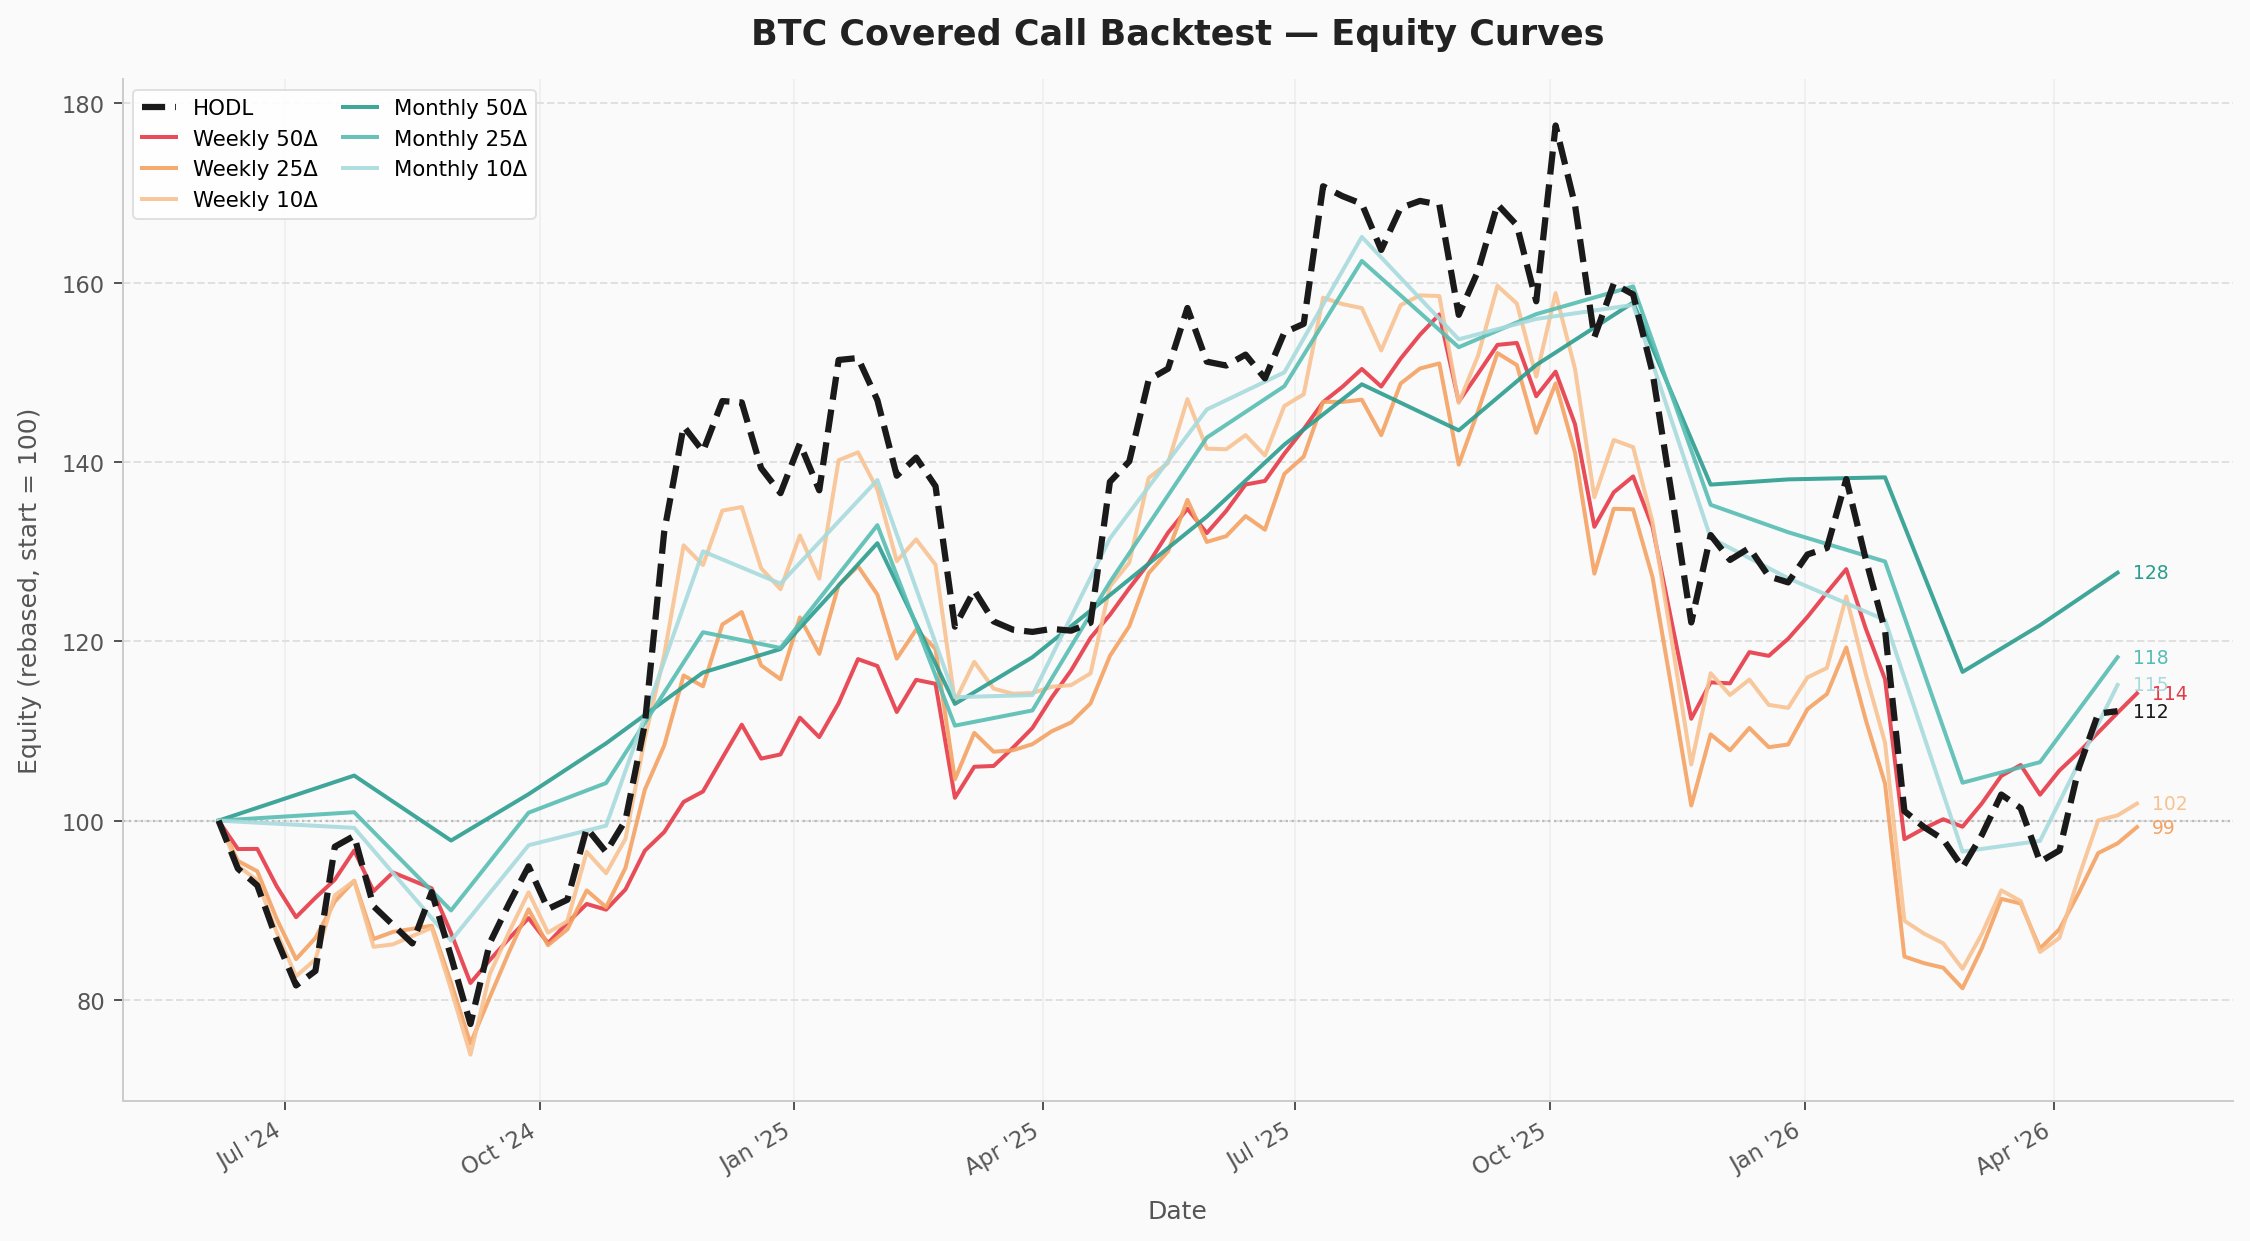
We backtested six BTC covered-call strategies — weekly and monthly rolls at 10Δ, 25Δ, and 50Δ — against a HODL (buy and hold) benchmark over the two years from June 2024 to May 2026.
The headline result: Monthly 50Δ returned +27.6% with a max drawdown of −26.1%, compared to HODL's +12.2% and −46.6%. Two strategies (Weekly 25Δ, Weekly 10Δ) underperformed HODL.
Methodology
| Data source | CryptoVol.io |
| Period | 7 Jun 2024 – 8 May 2026 |
| Underlying | BTC, 1 unit held throughout |
| Rolls | Weekly: every Friday. Monthly: last Friday of each month |
| Strike | Resolved from target delta on the fitted vol surface |
| Fill | BS mid, no spread |
| Settlement | Hold to expiry; assigned cash flow = max(0, S − K) |
Equity is the BTC value plus accumulated cash from premiums net of assignment losses, rebased to 100 at start.
Results
| Strategy | Total Return | Annualized | Sharpe | Max DD |
|---|---|---|---|---|
| Monthly 50Δ | +27.6% | +13.9% | 0.67 | −26.1% |
| Monthly 25Δ | +18.2% | +9.3% | 0.44 | −35.8% |
| Monthly 10Δ | +15.1% | +7.8% | 0.39 | −41.5% |
| Weekly 50Δ | +14.2% | +7.2% | 0.41 | −37.4% |
| HODL (benchmark) | +12.2% | +6.3% | 0.36 | −46.6% |
| Weekly 10Δ | +1.9% | +1.0% | 0.23 | −47.7% |
| Weekly 25Δ | −0.7% | −0.4% | 0.17 | −46.6% |
Three observations
1. Monthly dominated weekly at every delta. Same-delta comparisons: 50Δ monthly +13.4pp vs weekly, 25Δ +18.9pp, 10Δ +13.2pp. Monthly produced higher Sharpe and lower drawdown in every bucket. The IV–RV spread is harvested more cleanly at 30 days than at 7, and weekly rolls incur additional path-dependent drag from frequent strike resets in trending markets.
2. ATM outperformed OTM within the monthly cohort. Returns scaled inversely with moneyness: 50Δ (+27.6%) > 25Δ (+18.2%) > 10Δ (+15.1%). The vol risk premium concentrates near at-the-money where vega is largest. Deep-OTM premiums are too small to compensate for the tail exposure they create.
3. Outperformance came from drawdowns, not rallies. Covered calls underperformed HODL during the Nov 2024 – Mar 2025 rally (BTC: ~$70k → ~$108k) as short-call caps bound. They outperformed during the Sep 2025 – Feb 2026 drawdown as accumulated premium offset spot losses. The Monthly 50Δ vs HODL gap is largely a function of the recent drawdown.
Implementation
The full backtest required one endpoint per roll to retrieve the data needed:
import requests

def get_call_for_target_delta(date, expiry, delta_target):
    """Returns strike, vol, BS premium, spot, and Greeks for a target-delta call."""
    r = requests.get(
        "https://api.cryptovol.io/v1/vol-surface",
        headers={"X-CryptoVol-Key": YOUR_API_KEY},
        params={
            "ccy":               "BTC",
            "date":              date,
            "expiry":            expiry,
            "strike_type":       "delta",
            "strike_value":      delta_target,
            "option_type":       "C",
            "session":           "us",
            "include_analytics": "true",
        },
    ).json()
    return {
        "strike":  r["strike"],
        "vol":     r["vol"],
        "premium": r["analytics"]["price"],
        "spot":    r["analytics"]["spot"],
        "delta":   r["analytics"]["delta"],
    }
Caveats
- Mid-price fills. No bid-ask spread modeled. Live results for Monthly 50Δ would be 2–4pp lower; Weekly 10Δ would be substantially worse given wider relative spreads on small premiums.
- Cash is not reinvested. Accumulated premium sits idle at 0%. In practice, parking cash in T-bills or stablecoin lending at ~4–5% would add roughly 1–2pp to total returns for the covered-call strategies. HODL holds no cash and is unaffected, so the comparison is biased against the option strategies.
- Sample size. 97 weekly rolls and 22 monthly rolls. Monthly point estimates have wide confidence intervals.
API access
The vol surface, pricing, and Greeks are available via the CryptoVol API.
Get an API key →